Get Started with Hue
Hue is a web-based interactive query editor in the Hadoop stack that lets you visualize and share data.
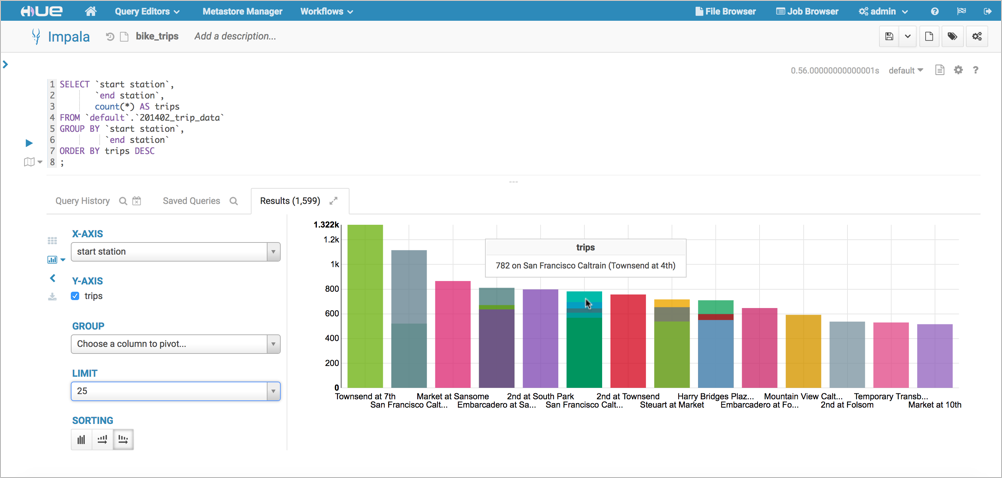
Figure 1. Impala Query Results in Hue
Play with Hue
Analyze and visualize your data with Impala, a high-speed, low-latency SQL query engine.
 Tip: If you don't have your own Hue instance, try running sample queries on http://demo.gethue.com/.
- Log on to Hue: select .
- Download and unzip one year of bike trips from the Bay Area Bike Share program (~80 MB).
- Create a table from ~/babs_open_data_year_1/201402_babs_open_data/201402_trip_data.csv.
- Go to the Metastore Tables Manager (or Tables Browser).
- In the default database, click the Create Table icon
 .
. - Set Type = File.
- Set Path by dragging 201402_trip_data.csv to the Path field.
- Set Formats (Comma, New Line, Double Quote) and click Next.
- Set Properties Format = Csv.
- Edit Fields and click Submit:
- Change ZipCode to data type string.
- Rename Bike # to Bike ID.
- Click Run
 to execute a select query in Hive.
- Go to .
- Click Refresh
 and select Perform incremental metadata update to display your new table.
 - Input a query into the editor, for example:
select `start station`, `end station`, count(*) as trips from `default`.`201402_trip_data` group by `start station`, `end station` order by trips desc;
- Click Format
 to make the query multi-line.
 - Click Save
 , input a query name, and click Save.
 - Click Execute to run the query.
- Click Refresh
- Create a Bar chart by clicking
 :
:
- Set the X-axis as start station and the Y-axis as trips. A bar chart displays.
- Set the Limit to 10.
- Create a Pie chart by clicking
 .
. - Download the results by clicking
 and selecting CSV or Excel.
To learn more about the power of Hue, see Hue How-tos.
Page generated September 13, 2018.
| << Troubleshooting Apache Hive in CDH | ©2016 Cloudera, Inc. All rights reserved | Hue Versions >> |
| Terms and Conditions Privacy Policy |